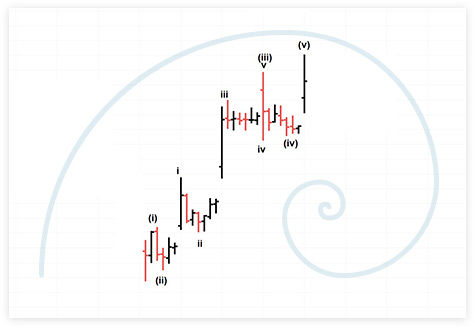
Dale Woodson, a gifted student as a child, and an avid Elliott Wave student since 1996, has mastered the keys to Elliott Wave.
 Hi! My name is Dale Woodson. I founded Woodson Wave Report in December of 1997. I publish Woodson Wave Report to help you catch the next turning points in the markets. As a trader, you can use this information to increase your profits. As an investor, you can protect yourself from downturns in the market. Elliott Wave is truly one of nature’s most amazing treasures. It is apparent in many aspects of life, but is best viewed and studied in the stock market. The predictive value of Elliott Wave has been demonstrated throughout history.
Elliott Wave History
In 1960, A. Hamilton Bolton used Elliott Wave to project a Dow 1000 target turning point. On February 9, 1966 the Dow registered a high of 995.82 (intraday high was 1001.11).
In 1970, A.J. Frost calculated the next turning point low in the Dow at 572. Four years later, the exact hourly low in December, 1974 was 572.20!
In Elliott Wave Principle written in 1978, Frost and Robert Prechter predicted a great bull market run to top at 2724 in 1987. In 1987, the Dow topped at 2722.42 before the crash.
Creating the Woodson Wave Report
Within three years of establishing WWR (Woodson Wave Report) we made Timer Digest’s Honor Roll, recognized as one of the top 10 rated and ranked newsletters based on performance of our signals vs. the S&P.
TIMER DIGEST* Honor Roll
2000 Dale Woodson # 7
2001 Dale Woodson #4
2008 Dale Woodson #5
2009 Dale Woodson #5
2011 Dale Woodson #6
2010 #1 Gold Market Timer of the Year
2016 #2 Gold Market Timer of the Year
2016 #2 Bond Market Timer of the Year

I am in awe of the beauty and perfection of Elliott Wave. I first discovered Elliott Wave by accident. In January of 1996, I went to the library to check out some books on technical analysis by John Murphy. Elliott Wave Principle by Frost and Prechter caught my eye so I decided to check it out. I had heard of Elliott Wave, but knew virtually nothing about it at the time. After reading the book, and all of R.N. Elliott’s Masterworks, I was fascinated with Elliott Wave. Immediately, I started to keep an hourly chart of the Dow on my basement wall. This is the best way to witness Elliott Wave formations first hand, on an hourly chart. Next, I did my own calculations based on my interpretations of the current wave patterns. One of my first projections called for a near term top in the Dow at 5797. On May 22, 1996, the Dow topped at 5797. Of course, 55 Fibonacci days later, the market bottomed at 5182. That was it! I knew right then and there that I was hooked for life.
I came to realize that the market always has and always will move in certain Elliott Wave patterns. Most of the time, this is obvious in hindsight. The Elliott Wave patterns will always be 100% correct, but the traders/investors/analysts who interpret the waves will not always be 100% correct because they are human. The first key is to realize when you are wrong. The second key is to admit it (this one is hard for some). The third key is to find the correct count, because it is out there. The true challenge is to figure out the pattern in real time, before the move, while there still is time to profit. This has been my mission since reading Elliott Wave Principle. Elliott Wave, combined with Fibonacci ratios gives us an advantage. To say I am obsessed with Elliott Wave and Fibonacci ratios would be an understatement. My mind is challenged to identify the patterns before their completion.
I have a real passion for my work. This is what I choose to do. Obsessed? Maybe. But I prefer to think of it more in terms of persistence or dedication. I won’t always be right, but fortunately, I know this in advance. The market timer who is never wrong does not exist. However, my percentage of accuracy should be high enough that you can protect yourself from downturns and profit from the targets provided in the newsletters and special reports. Thank you for subscribing to Woodson Wave Report.

